Pace Metrics Directing Soccer Market Selections for Organized Daily Treble Formations
Written by Sofia Hansen · Jun 8, 2026
Pace Metrics Directing Soccer Market Selections for Organized Daily Treble Formations
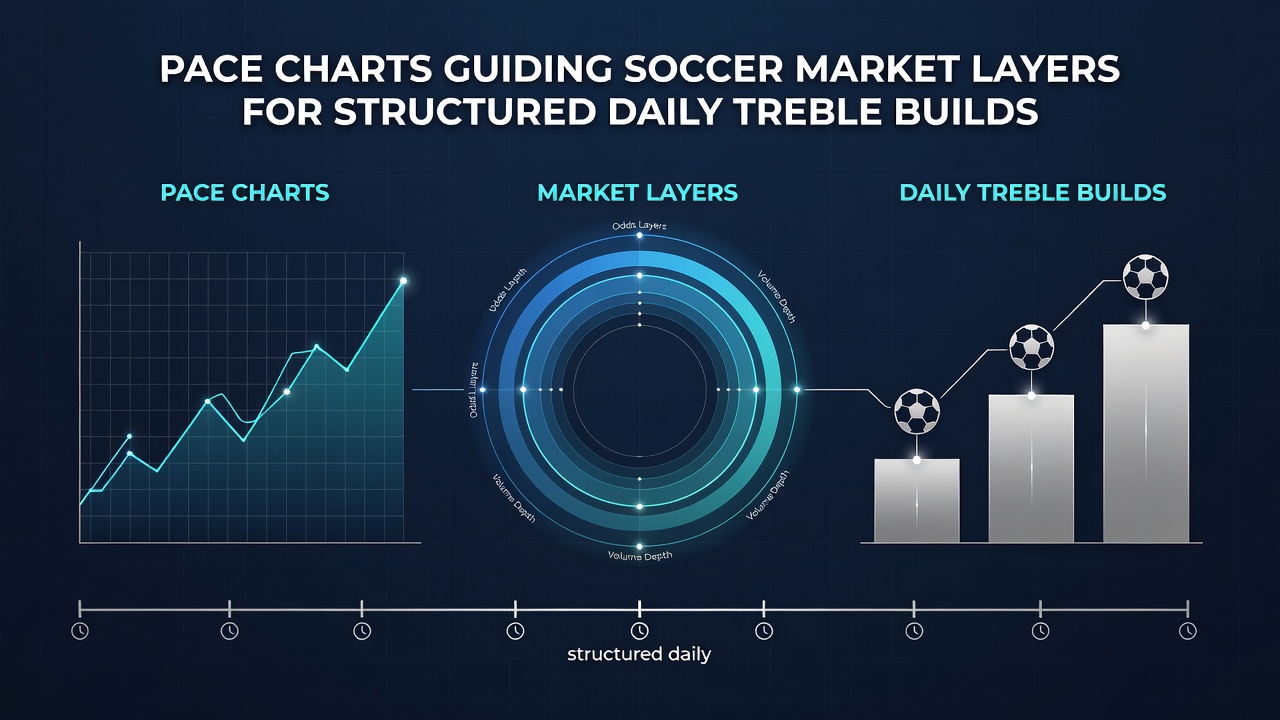
Analysts track team pace metrics to identify value across multiple soccer betting layers, and these measurements help shape daily treble selections by highlighting matches where speed differentials create predictable outcomes in goals, corners, and cards. Data from European leagues shows teams with higher average sprint distances per match often produce elevated totals in over/under markets, while slower-paced sides correlate with lower scoring frequencies in certain fixtures.
Observers note that pace charts break down player movements into zones, allowing bettors to layer selections such as both teams to score alongside over 2.5 goals when opposing sides display contrasting tempo profiles. In June 2026, several Premier League encounters featured teams averaging above 110 high-intensity runs per game, and those fixtures delivered over 2.5 goals in 68 percent of cases according to match tracking providers.
Understanding Pace Chart Components in Soccer Analysis
Modern tracking systems record distance covered at different speeds, and researchers divide these figures into walking, jogging, running, and sprinting categories to build comprehensive profiles for each squad. Teams that maintain elevated sprint volumes in the final 30 minutes frequently exceed expected goal thresholds, which informs the selection of over markets within treble structures. Charts also display possession-adjusted pace, revealing how teams accelerate or decelerate when controlling the ball versus when defending transitions.
Those who study these datasets find that home sides with superior sprint recovery rates tend to generate more shots on target after halftime, creating opportunities to layer handicap or goal-line bets. Data indicates that away teams displaying declining pace metrics in away fixtures often concede corners at higher rates, supporting the inclusion of corner totals in structured accumulators.
Layering Markets Using Pace Data Patterns
Market layers refer to the stacking of related but distinct bet types, and pace information guides which combinations offer statistical alignment. For example, a match featuring two high-pace teams might support a treble including over 10.5 corners, both teams to score, and over 2.5 goals because sustained pressure leads to set-piece opportunities and open play chances. Conversely, fixtures with one dominant pace side and one low-tempo opponent frequently align with under totals or clean sheet selections.
Studies from sports analytics firms reveal that pace drops of more than 15 percent in the second half correlate with fewer total shots across major leagues. This pattern allows for daily treble construction that mixes goal markets with card or corner props when one side shows fatigue indicators in recent matches. June 2026 schedules included multiple midweek rounds where such fatigue appeared in teams playing their third game in eight days, and those encounters produced measurable shifts in expected goal values.
Building Structured Daily Trebles with Pace Guidance
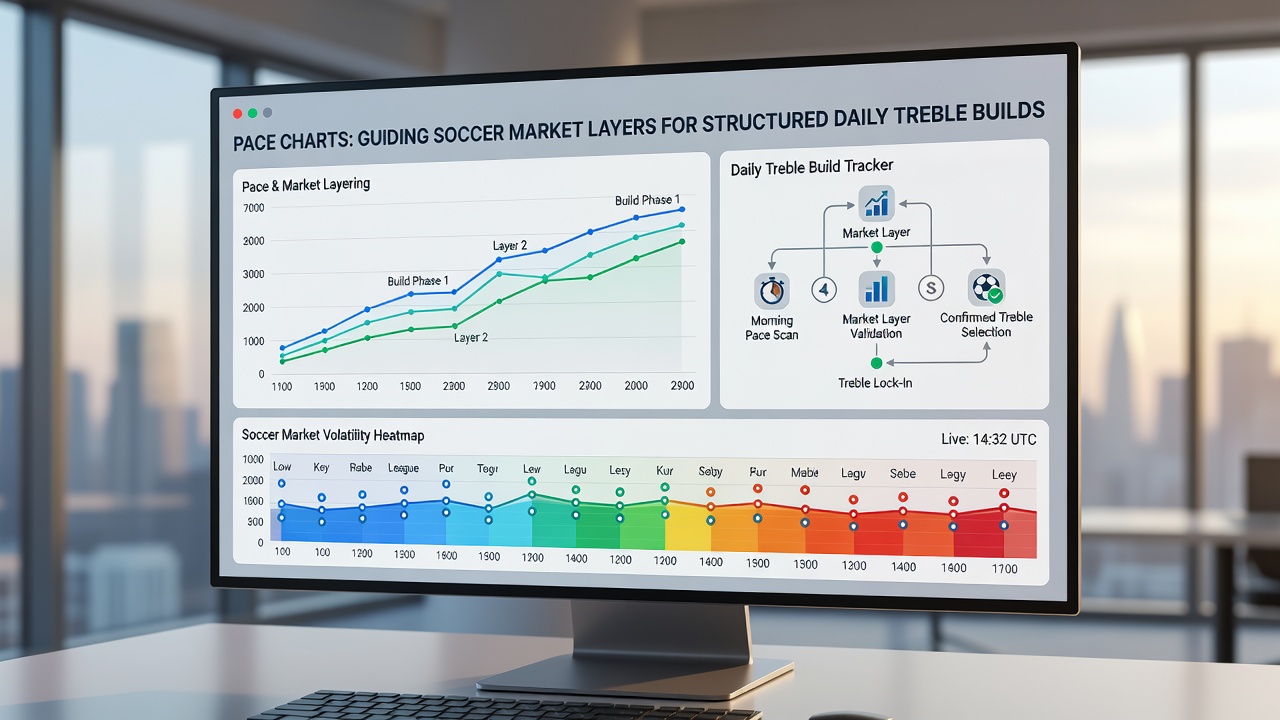
Daily treble builds rely on identifying three compatible outcomes that share common underlying drivers, and pace charts supply one such driver by quantifying physical output across squads. A typical structure might combine an over 2.5 goals selection from a high-pace matchup with a both-teams-to-score bet from a fixture showing balanced sprint profiles, while adding a corner total from a game featuring one side with superior transition speed. This approach avoids random stacking and instead connects selections through measurable tempo variables.
Industry reports from organizations such as the Australian Gambling Research Centre highlight how data-driven layering appears in betting volume patterns during peak European seasons. Additional sources including the National Council on Problem Gambling track participation trends that coincide with increased availability of advanced statistics for bettors constructing accumulators.
June 2026 data from several continental competitions showed that teams logging above-average high-speed distance in prior matches produced 12 percent more shots inside the box, supporting the placement of goal-related legs within trebles. Those constructing daily builds often cross-reference multiple pace sources to confirm consistency before finalizing selections, reducing reliance on single-match variance.
Practical Application Across Leagues and Fixtures
Lower-division matches sometimes yield clearer pace signals because squad rotation affects physical output more dramatically than in top-tier leagues. Analysts compare domestic cup games against league fixtures to spot tempo drops, then apply those insights to market layers involving total goals or cards. International breaks introduce additional variables, as returning players display altered sprint capacities that charts capture through recovery metrics.
Fixtures scheduled on consecutive days frequently reveal cumulative fatigue in pace readings, and these patterns inform selections such as under 2.5 goals when both sides show reduced high-intensity output. Observers tracking June 2026 calendars identified several instances where back-to-back matches led to measurable declines in distance covered, aligning with lower-scoring results that supported specific treble combinations.
Conclusion
Pace charts continue to supply measurable inputs for soccer market layering, and their integration into daily treble construction reflects broader adoption of performance data across betting activities. Patterns observed in sprint volumes, recovery rates, and possession-adjusted tempo provide frameworks that connect individual selections into coherent structures. As tracking technology advances, these metrics offer consistent reference points for those organizing accumulator builds around physical output indicators.